Increase Value Financially Part II
The next several blogs will focus on HOW TO INCREASE YOUR BUSINESS VALUE: FINANCIALLY, OPERATIONALLY, AND STRATEGICALLY. Today’s blog will present the Part II of how to increase your business value FINANCIAL – with Rifle vs. Shot Gun Marketing®.
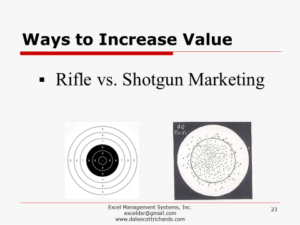
Rifle vs. Shotgun Marketing®
 This concept is Rifle vs. Shotgun Marketing® that combines industry segment growth rates and gross margin for each segment to help determine the highest value segments to concentrate on with a marketing program.
What is the value of a high-growth industry? Some examples will help explain.
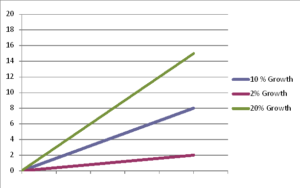
What if your industry’s growth rate is 2% per year but your financial projections show a 20% growth rate? Where do you get the 18% growth from? (20% projected growth vs. 2% industry growth). It must come from the competitor’s market share. It is very expensive to take market share from competitors. Therefore, your projections will have more doubt and less value to a potential investor or buyer.
What if the industry is growing at 20% and your projections are at 20% growth? You can obtain that growth from the industry growth rather than taking it from competitors. This is a  more probable scenario and would have a higher value component.
One CEO in New York was in a 2% growth industry but discovered a sub-segment that was growing at 200%. He shifted his marketing efforts to that segment and for the last three years they grew at 150% without taking market share from others.
Examine your product lines, market segments and find the segment(s) that have the highest growth rate. Then times that by the gross margin. Make a list of the combined scores from highest to lowest. The highest value segment has the highest potential company financial return. Focus the marketing and promotion efforts and expenses in that area. This will give the greatest return on the investment and higher value probability.
Topics on Financial value increase tools to follow include:
- Net Profit: History and Potential: Management Accounting vs. Financial Accounting
- $1 Expense Reduction = $1 Net Profit Gain
- $1 Sales Gain @ 25% Cont. Margin = $0.25 N Profit Gain
- Contribution Margin: Break–even
- Financial Qualitative Performance
- A/R Days – A/P Days
- Cash Flow
- Valuation Metrics
- Performance Dashboard
ABOUT DALE S. RICHARDS:
Dale S. Richards specializes in management, marketing, operation optimization & business valuation consulting and is a 30+ year turnaround expert. He has implemented success concepts into results in 150+ companies. Dale is a Certified Valuation Analyst (CVA) with NACVA, Eight-Year Vistage Chair & International Speaker.


