Elements to Increase Value Part VI
Elements to Increase Value Part VI.
Valuation Metrics and Performance Dashboard Elements
Elements to Increase Value Part VI. This blog is a continuation of the series on How to increase your business value with financial concepts:
- Financially – Part VI
Today’s blog will present the 12-month rolling graphs and performance dashboard elements.
Rolling 12 Month Graphs
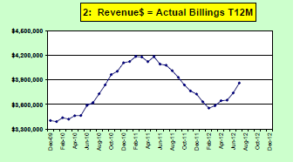
Year-to-Date (YTD) financial statements are almost useless until the 4th quarter. Almost all financial software programs have YTD as their standard. A much more effective tool is a 12-month rolling history which can also be used to create a 12-month budget monitor.
A 12-month rolling metric tracking system can work on most performance metrics. It works by adding up the 12 months data and then insert that data point monthly into a graph or other time basis. For example, if you have a 12-month rolling point and want to add this month (say June) then you add this June into the sum and remove last June’s number.
With a 12 month rolling metric any change in slope is significant because a current month replaces a past year month. Any change represents a change in the month’s activity rather than waiting  for YTD to get to the 4th quarter.
Valuation – Performance Metric
It is recommended that a business valuation be done every two years. With the author’s nine methods and calculations, it can be used as a metric for management performance. Are the net assets improving? Is the cash flow better? What impact does that have on the market value method? If the net cash flow is increasing the statistically projected method will show a rise. The author discusses these nine valuation concepts in his book. “Business Valuation Principles Made Easy with How to Increase Value Financially”.
Financial Reporting Dashboard Elements
Some elements that could be included in a graphical dashboard are shown below. Graphs are much easier to assess the company performance that a series of data tables. The author suggests the following graphical metrics:
- A/R,
- A/P,
- Inventory,
- Capital
- Overall Cash Flow,
- Contribution Margin (CM)
- Break-even Dollars and Units
- Productivity Index: (Rev. $/FTE & CM$/FTE)
- Revenue
- Net Income
- Average Sales Price/Unit
ABOUT DALE S. RICHARDS:
Dale S. Richards specializes in management, marketing, operation optimization & business valuation consulting and is a 30+ year turnaround expert. He has implemented success concepts into results in 150+ companies. Dale is a Certified Valuation Analyst (CVA) with NACVA, Eight-Year Vistage Chair & International Speaker.


