Graphical Representation Of Cash Flow
A graphical representation of cash flow is one of the most important tools for an executive and should be included on any performance metrics dashboard. A spreadsheet should also be used to translate the accounting cash flow statement into a rolling 12-month history and a 12-month future cash flow measurement tool. Graphical cash flow with rolling historical data can make future projections easier to complete. These tools can be critically important for growth, seasonal trends or shrinking companies.
Many companies have died in their growth because they did not track cash flow or the needed cash flow resources.
Financial Reporting Dashboard
Some elements that could be included in a graphical dashboard are shown below. Graphs are much easier to review and assess company performance than a series of data tables. I like to suggest the following graphical metrics:
- A/R
- A/P
- Inventory
- Capital
- Overall Cash Flow
- Contribution Margin (CM)
- Break-even Dollars and Units
- Productivity Index: (Rev. $/FTE & CM$/FTE)
- Revenue
- Net Income
- -Average Sales Price/Unit
Financial Performance Metrics Graphs – Examples
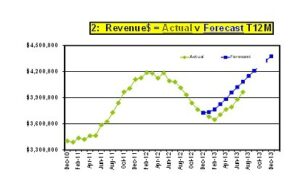
Revenue Actual with Forecast
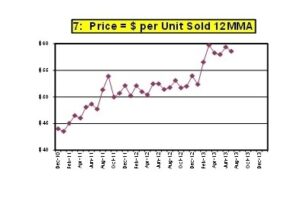
Price – $ per Unit Sold
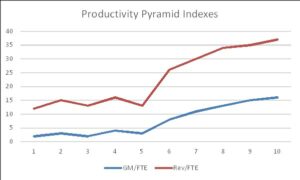
Productivity Indexes:
Revenue per Full-Time Employee (Rev/FTE)
Margin per Full-Time Employee (GM/FTE)
_______________________________
Performance Dashboard is key to enhancing performance from Dale Richards Valuation Presentation.
Dale Richards’ Valuation & Dashboard Presentation was a hit in Virginia. Matt McKelvey, a valuator himself, learned many new methods and uses for the Valuation analysis, calculations and report as described by Dale. He also plans to implement the Contribution Margin and Cash Flow graphical techniques for his clients. He highly recommends Dale as a presenter, author, and certified valuator.
ABOUT DALE S. RICHARDS:
Dale S. Richards specializes in management, marketing, operation optimization & business valuation consulting and is a 30+ year turnaround expert. He has implemented success concepts into results in 150+ companies. Dale is a Certified Valuation Analyst (CVA) with NACVA, Eight-Year Vistage Chair & International Speaker.


